
By David Massey

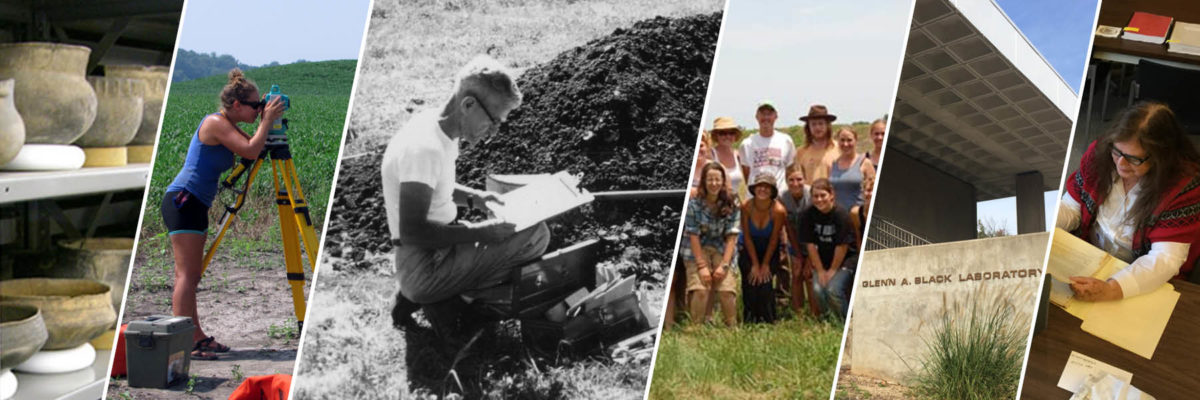
Hello! I’m David Massey, and I am a PhD Candidate in the Department of Geography at Indiana University. This summer I was working in the Glenn Black Lab rehousing faunal materials from Angel Mounds as part of the “Saving America’s Treasures” (SAT) project. It was fascinating to see the range of faunal material coming from the site, from the tiniest rodent teeth to drumfish jaws and deer antlers.
My research focus is on the use of remote sensing technologies to investigate archaeological sites. Remote sensing is a broad term that refers to the non-invasive acquisition of information about a physical landscape. While most remotely sensed data comes from satellites or aircrafts, drones fly much closer to the Earth’s surface and are able to collect finer resolution data. Archaeologists are increasingly using drones to survey landscapes for this reason. I’m currently working on a project at Angel Mounds using Light Detecting and Ranging (LiDAR) topographic models derived from an aircraft and a drone. This will help us understand the labor involved in constructing the mounds and what this tells us about the degree of social complexity among the inhabitants.
We’re very fortunate that Glenn Black had the foresight to systematically excavate Angel Mounds. After excavating at Nowlin Mound in 1934-1935, Black (1936) wrote that “if the results of any excavation are to provide an unimpeachable historical record of a prehistoric work, too much stress cannot be placed upon methodical technique and exactness of detail, no matter how trivial the feature may be.” This attention to what some at the time deemed trivial details enables archaeologists to discover and examine spatial patterns in the archaeological record through a Geographic Information Systems (GIS) database today. GIS is an essential tool for archaeologists because it allows for the analysis and visualization of large amounts of spatial data.

Glenn Black divided the entire site into Subdivisions, Blocks, and Depths. Each Subdivision is a 100 x 100-foot square. Within each Subdivision is one hundred 10 x 10-foot Blocks. Each Block is labeled from 0 – 9 along the y-axis and into Left and Right from 1 – 5 on the x-axis. Each Block is additionally separated into 6 categories of depth in feet: 0.0 – 0.4, 0.4 – 0.8, 0.8 – 1.2, 1.2 – 1.6, 1.6 – 2.0, and 2.0 – 2.4. All this information can be displayed in GIS as a shapefile. A shapefile stores information about specific geographic features such as their location, shape, and attributes.

This past summer we rehoused faunal material from 17 different Subdivisions. These records get updated in a Filemaker database and form the basis for the GIS database. The naming conventions of fields within the GIS and Filemaker database become very important at this point, because at least one must match for the data to be imported and joined correctly.

Excel inventory for Angel (2019) 
Angel database (2019)
Below is an example of one Subdivision our team worked on this summer.

Subdivision X-11-C contains 1,936 faunal records and 88 of 100 Blocks currently have data associated with them. The total weight of all bone within X-11-C is 573.6178 kilograms, while the average weight of bone across all X-11-C Blocks is 5.86082 kg. It’s possible to see concentrations of bone across this Subdivision. In Figure 6, darker shading indicates a higher standard deviation across this Block compared to the mean (5.86082 kg), while lighter squares indicate lower standards of deviation. Depth information, which has not been added yet, would provide more chronological insight. Moving forward, we hope to have all excavation data in a GIS database to conduct more sophisticated spatial analyses of faunal, lithic, and ceramic material to help us better understand the landscape around Angel Mounds.
References:
Black, Glenn A. (1936). Excavation of the Nowlin Mound: Dearborn County Site 7, 1934–1935. Indiana History Bulletin, 13(7), 197 – 342.
MORE ABOUT IMLS
The Institute of Museum and Library Services is the primary source of federal support for the nation’s libraries and museums. We advance, support, and empower America’s museums, libraries, and related organizations through grantmaking, research, and policy development. Our vision is a nation where museums and libraries work together to transform the lives of individuals and communities. To learn more, visit www.imls.gov and follow us on Facebook and Twitter.
(The views, findings, conclusions, or recommendations expressed in this blog post do not necessarily represent those of the Institute of Museum and Library Services.)